
Case Study: What’s this medal worth?
Collector markets often appear unpredictable. Two items that look nearly identical may sell for very different prices, leaving both buyers and sellers uncertain about what truly drives value.
This case study examines a large dataset of medals from the historical collectibles market to identify the key factors behind pricing. The analysis focuses on elements such as tiering systems, scarcity, condition, provenance, and time trends.
While medals serve as the case example here, the broader goal is to show how structured data and statistical analysis can reveal the drivers of value in any niche market. The same methods apply to other collectible and luxury categories — from art and jewelry to sneakers and NFTs.
Objective & Approach
Objective
Identify the main drivers of value in the historical collectibles market, using medals as a focused case study.
Why it matters
This shows how data analysis can uncover value drivers in niche markets — lessons that generalize to any supply–demand context, from collectibles to luxury goods and even digital assets.
Approach
Data gathering – Scraped sales records from multiple dealer websites and standardized them into a clean dataset.
Feature engineering – Added structured fields such as tier, condition, maker, and whether the item included ribbon, box, documentation, or provenance.
External context – Incorporated issuance estimates to approximate scarcity.
Analysis methods – Combined exploratory visualizations with regression and feature importance models to quantify the effect of each factor.
Validation – Checked for outliers, misclassifications, and survivorship bias to ensure findings were robust.
Dataset & Preparation
Data source. I scraped listings from 100+ dealer sites across Asia, North America, and Europe. These are independent businesses with different site structures, so this is real-world, messy data—not a canned dataset.
Taxonomy & labeling. I built a six-level taxonomy—conflict → nation → supergroup → item type → medal group → medal name—using references (books/sites) and my own collecting experience. I classified records with a local ML model and used the OpenAI API as a fallback on low-confidence cases. To keep the scope tight and comparable, I narrowed this study to WWII medals.
Focus set. To maximize statistical power, I used the largest slice in my data: the Germanic medal group (as defined in my taxonomy). After cleaning, the dataset contains 11,940 medals, spanning 500 medal names across 18 medal groups. Currency mix skews European (≈54% EUR, 30% USD, 14% GBP, ~2% other).
Cleaning & normalization
Enforced medals-only rows; dropped ambiguous names (e.g., “Unknown”, “Misc”).
Deduped by URL, keeping the latest
date_modified.Converted prices to USD via spot FX (EUR, GBP, AUD, CAD, NZD, CZK) and inflation-adjusted all values to constant USD at the latest CPI month.
Standardized condition labels where present (poor / good / excellent).
With help from the OpenAI API, I parsed unstructured descriptions to flag extras like boxes, ribbons, documents, envelopes, and provenance, turning them into consistent yes/no columns for analysis.
Trimmed price outliers (kept 2nd–99th percentiles) to reduce noise without wiping real edge cases.
Why this matters. This is the boring but essential part: taking inconsistent web data from 100+ sources and turning it into something analysis-ready and comparable. The same pipeline generalizes to any niche market with messy inputs.
Data Overview
A few staples dominate volume. Four names—EK2 (1,098), Infantry Assault Badge (630), EK1 (558), Wound Badge Black (542)—make up ~24% of the dataset (2,828 / 11,940).
Tiering shows up immediately. Within families, the “higher” variant sells higher: EK1 > EK2; Wound Badge Gold > Silver > Black; War Merit Cross 1st > 2nd, and with swords > without.
Some badges punch above their weight. Items like the Luftwaffe Flak Badge have lower volume but noticeably higher typical prices than mid-pack medals.
Not one-note. By group, Iron Cross is the largest slice (≈16%), with combat awards next (≈13%), then wound badges (≈10%); political/branch, merit, and campaign/service each contribute meaningful single-digit shares.
What this means
Price isn’t just about popularity—tier/variant matters, and extras/maker/condition likely explain the wide spreads we see (to be quantified next).
Group mix (share of cleaned dataset)
Iron Cross ≈16%, combat ≈13%, wound ≈10%; other groups each add solid single-digit share—broad coverage beyond a single family.
Takeaway:
The dataset spans high-volume, lower-price staples (EK2, Wound Badge Black) and rarer, higher-price pieces (e.g., Knight’s Cross), setting up the next sections on tiering and feature effects.
Top-15 medals by volume (bars) with median price (line)
Four staples drive ~¼ of listings. Median prices rise with tier (e.g., EK1 > EK2, with swords > without), while a few lower-volume badges show stronger medians.

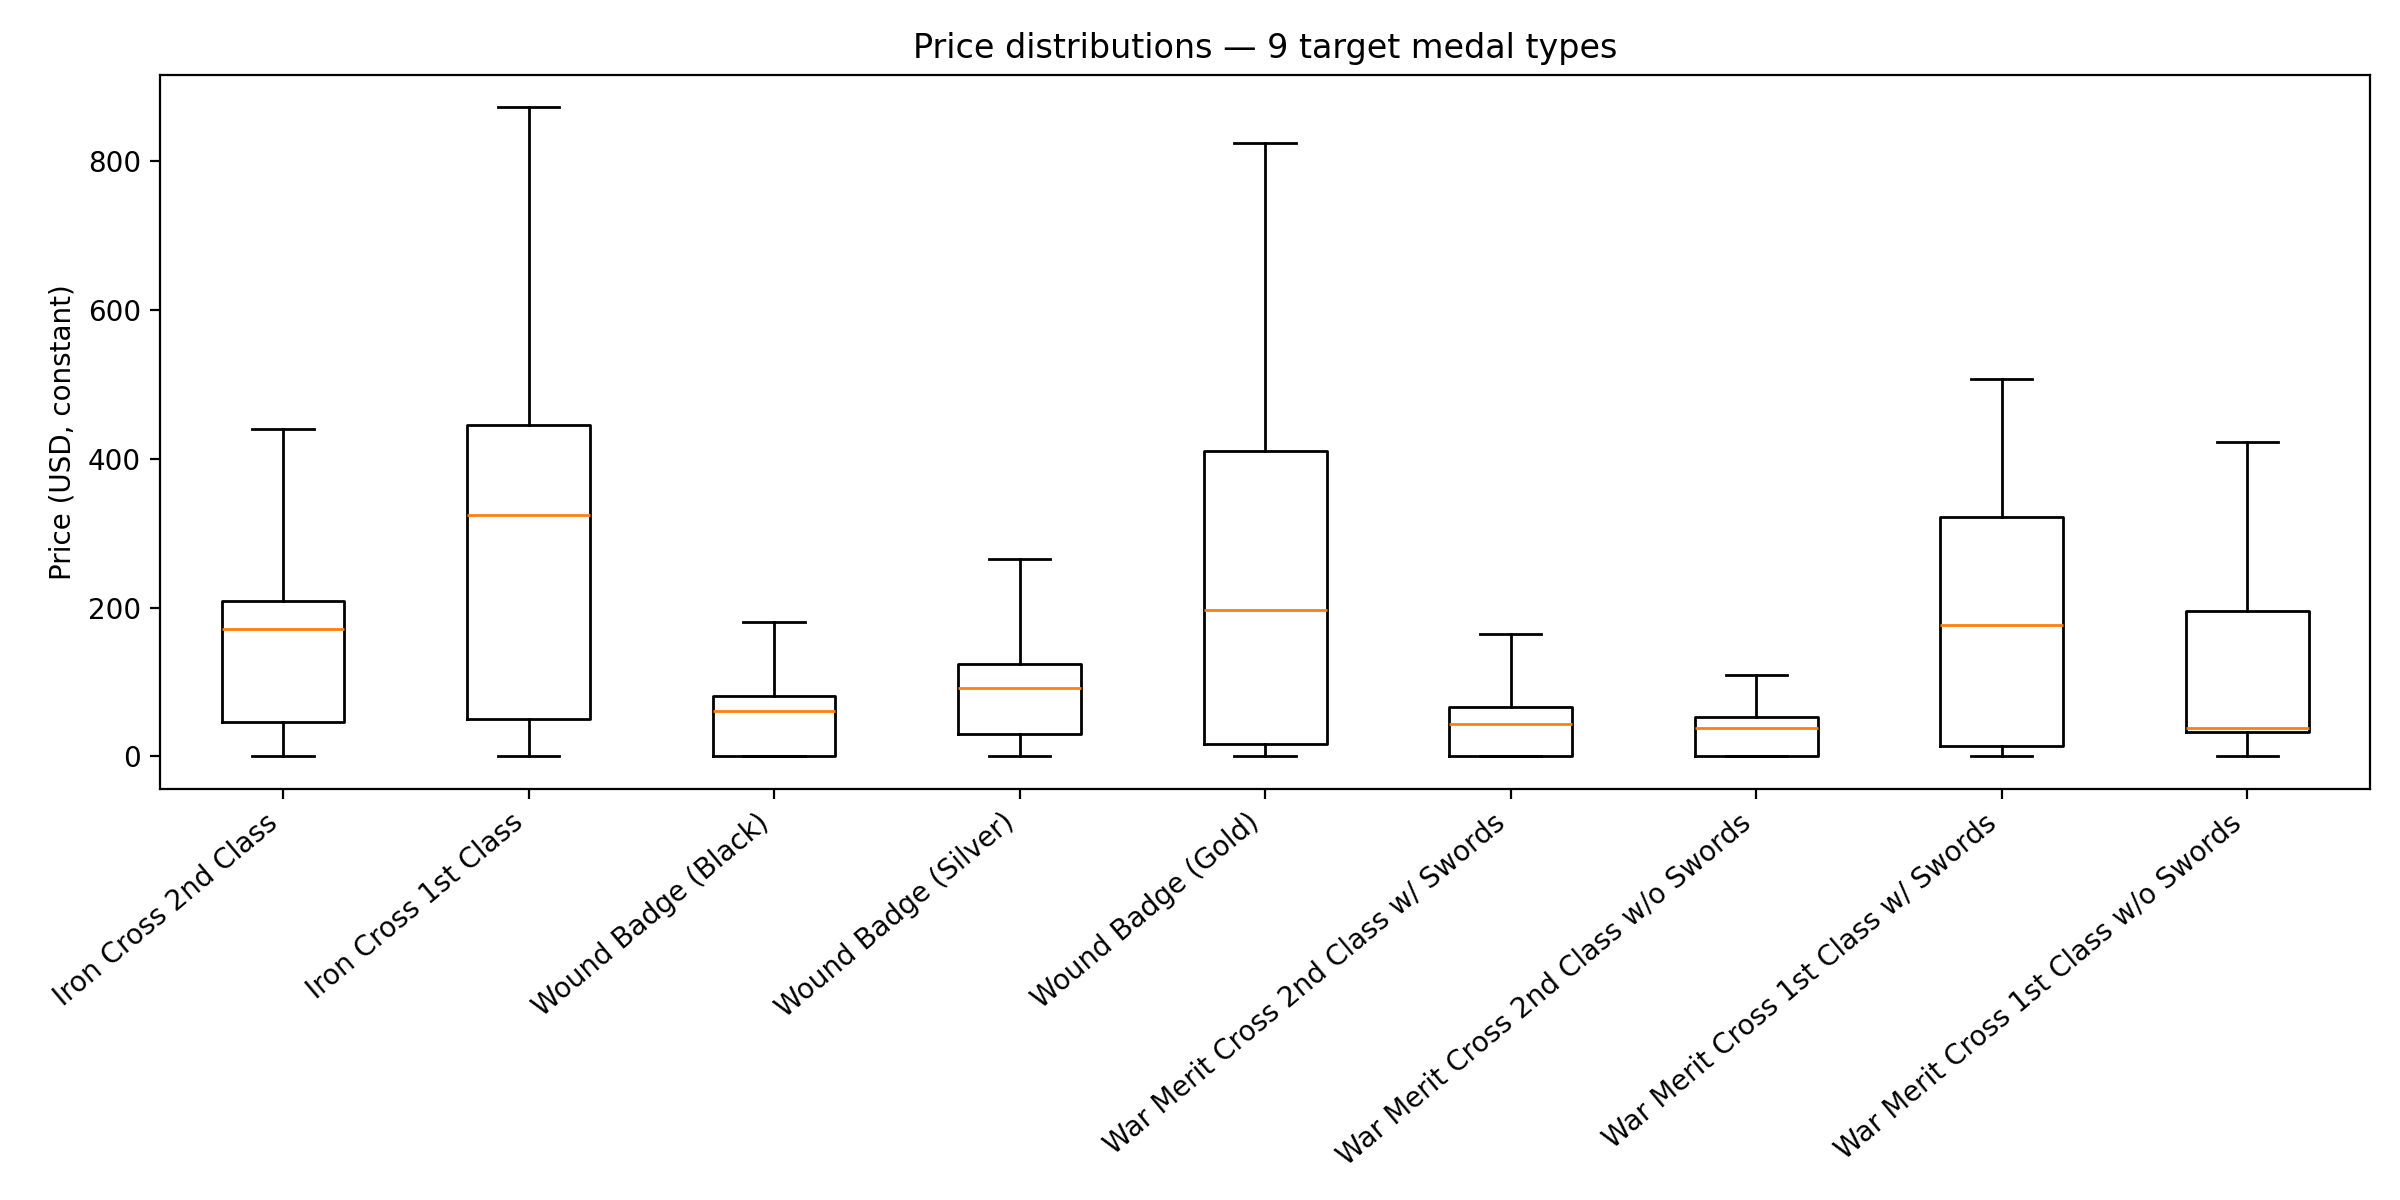
Price distributions (ordered by families/tiers)
Ladders are clear: EK1 > EK2; WB Gold > Silver > Black; WMC 1st > 2nd, and with swords > without. Wide boxes/whiskers hint at maker, condition, and documentation effects.
Tier Analysis
Question
Within the same medal family (series), do higher tiers sell for more?
How I compared
I restricted to complete medals (hardware present), removed extras that inflate price (no box, no documents; ribbon optional; components/miniatures/groupings excluded). Then I computed median price with IQR/2 by tier (n≥30).
What stands out (with n):
Iron Cross: EK1 trades at $308 (n=345), about +78% vs EK2 at $174 (n=876).
Wound Badge: step-ladder—Silver $87 (+45%), Gold $108 (+79%) vs Black $60; Gold is low-N (n=34) so I keep wide error bars.
War Merit Cross: the premium is about the swords, not class alone.
1st Class (with swords): $144 (+239%) vs 2nd Class (w/o swords) baseline $42.
1st Class (w/o swords): $38 (−9%)—does not command a premium.
Why this matters
Tier effects are strong and non-linear. Variant semantics (e.g., “with swords” = combat merit) drive large price jumps—useful signal we’ll combine with scarcity, maker, condition, and documentation in the next sections.
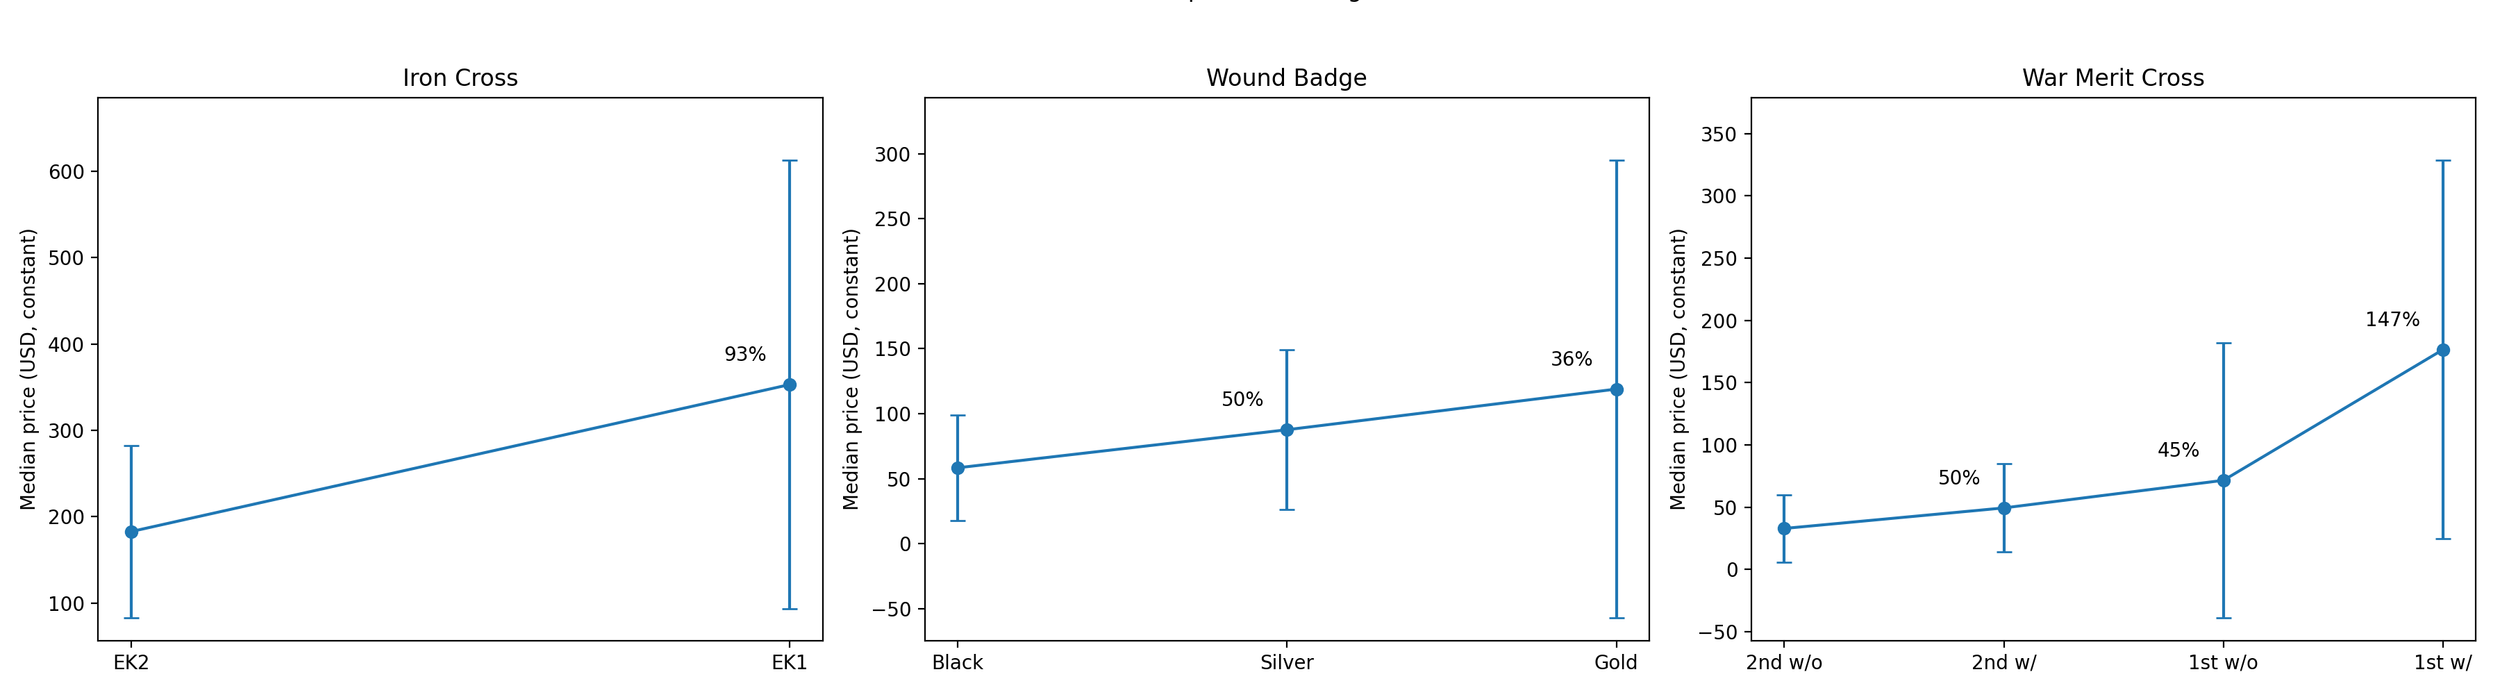
Tier ladders (complete medals; no box/docs). EK1 ≈ +78% vs EK2; Wound Silver/Gold ≈ +45%/+79% vs Black; WMC 1st w/ swords ≈ +239%, while 1st w/o does not add value.
Scarcity & Extras
What I did
I linked each medal type to an estimate of how many were produced and split listings into common / scarce / very rare. Then I measured the impact of documentation and original boxes one at a time while holding the other extras off, so the comparison stays apples-to-apples.
Scarcity drives price. On a log–log chart (Scarcity vs price my medal type), types that were produced in smaller numbers trade higher. EK1 (~0.3M) sits above EK2 (~4.5M); WMC 1st Class w/ swords sits above 2nd Class variants. The slope is modest here because we only have a handful of types, but the direction is clear.
Documentation helps—especially for common pieces. In the common bucket, medals with documents sell for roughly ~40% higher on the median in this cut. (The scarcer buckets don’t yet have enough “with docs” volume to chart cleanly.)
Boxes matter when items are scarce. For very rare medals, an original box shows a large premium; for scarce items it’s a moderate bump; for common pieces it’s small to negative on its own.
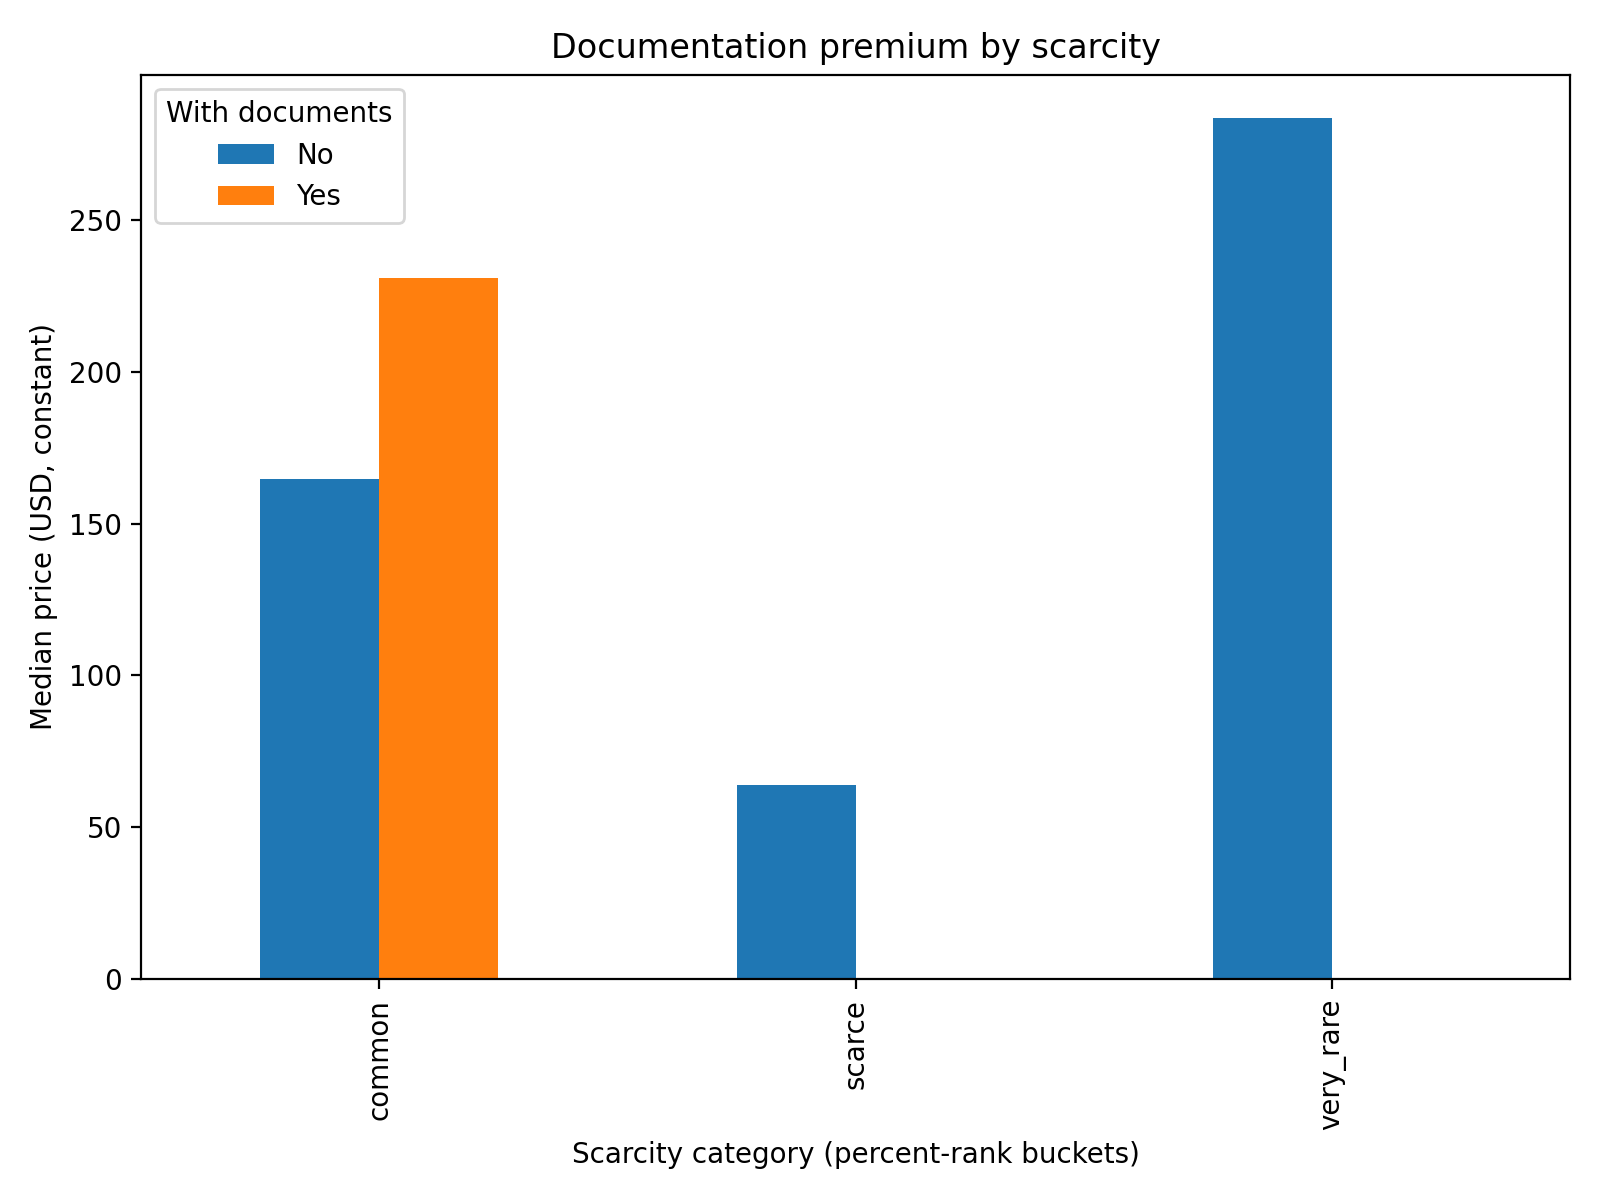
Documentation premium by scarcity (isolated).
Within “common,” with documents ≈ +40% median vs no docs. Scarce/very-rare buckets need more “with docs” examples to quantify, but wherever they appear the direction is up.
Why this matters
If you’re buying or pricing, prioritize scarcer types, and for those, documents and original boxes are worth chasing. Don’t overpay for boxes on common medals unless the piece is exceptional.

Scarcity vs price by medal type (log–log).
Lower issuance generally maps to higher median price. EK1 > EK2; WMC 1st w/ > 2nd class variants. Negative trend is modest with the current sample but directionally consistent.

Box premium by scarcity (isolated).
Very rare: clear premium with box (biggest lift). Scarce: small-to-moderate lift. Common: little or negative effect when box is the only extra.
Feature Impact
What I did
I fit a model that controls for what the item is, how common it is, who made it, and condition, then measured how much common “extras” move price.
What matters most
Original box is the big one. On average it adds ~75% to price — the most consistent lift.
Documents help, typically ~20–40%, but there aren’t many of these in the data, so treat it as directional.
Condition helps, but it’s not the main lever: roughly +5–10% per grade (poor → good → excellent).
Scarcity still matters. Even when controlling for type, maker, and condition, items that were produced in larger numbers tend to be worth less. Roughly speaking, if the number of surviving pieces doubles, average price falls by about 10–15%.
Ribbons & generic “provenance” notes show little average effect once we control for everything else (can still matter case-by-case).
Type & maker set your starting point. Core types (EK2/EK1) price ~+100% vs “other”, and a few makers (e.g., Deschler & Sohn) show ~+15–25% premiums.
Model sanity check: test R² ≈ 0.63 — good enough for directional decisions.
Why this matters:
If you’re pricing, buying, or listing items, focus first on type & maker (your base), then look for the box (largest, reliable multiplier), give documents credit when present, and adjust for condition and scarcity.

Box is the strongest and most reliable premium (~+75%). Documents likely add value (data thin). Condition helps modestly; scarcity lowers price; ribbon/provenance show little average lift.

Bars show % premium relative to a “typical” (catch-all) type/maker after controlling for scarcity and condition. Example: “type: EK1 = +110%” ≈ EK1 sells ~2.1× a typical non-core type, all else equal.
Market Dynamics Over Time
What I looked at
Prices and “time to sell” for EK1 and EK2 over the last year.
How I measured
I grouped sales by month and looked at the middle price (median).
I used a 6-month rolling line so the trend is smooth.
Dates come from the best available posting time (date_posted_estimate → date_sold → date_created).
I removed near-duplicate entries that appeared within 60 seconds of each other.
Prices are in today’s dollars.
The light band around each line shows the “typical range” (the middle 50% of sales).
What stands out
EK1 (1st Class): After a late-2024 surge, prices settled in the low-to-mid $400s through 2025, and the spread tightened.
Typical time to sell: ~69 days (faster).EK2 (2nd Class): Prices held around $190–$210 with a steady, tighter range.
Typical time to sell: ~101 days (slower).Dealer cross-check (BEVO): Their prices moved the same direction as the wider market—slightly higher at first, then converged to market levels by mid-2025.
Why it matters
The late-2024 spike cooled off. 2025 looks orderly: EK1 sells quicker and higher, while EK2 is more of a value buy unless condition or maker is special. This helps both buyers and sellers set realistic expectations on price and time.

EK1 (top plot)
Late-’24 spike → early ’25 pullback
Stabilizes in the low-to-mid $400s
Band narrows = tighter pricing / less haggling
EK2 (bottom plot)
Drifts from ~$230 → $190–$210
Steady range most of 2025
Shaded band stays modest = predictable market
Takeaways
Tier matters. Higher grades and “with swords” versions almost always sell for more.
Scarcity counts. Items made in smaller numbers bring higher prices; common pieces don’t get the same boost.
Extras only help when rare. Boxes and documents add value, but mostly on harder-to-find medals. On common ones, they don’t move the needle much.
Maker and type set the base price. Core pieces like EK1/EK2, and certain well-known makers, act as price anchors.
Trends are stable. EK1 has leveled out around the low-to-mid $400s, EK2 around $200, with clear differences in how fast each one sells.

Conclusion
Prices aren’t random. They follow a clear pattern once you look at the right signals. The medal’s tier sets the starting point, scarcity pushes values up, and extras like boxes or documents only matter when the item itself is uncommon. Condition helps too, but not as much as collectors often think.
For collectors, this means you can set more realistic expectations when buying or selling. For me, it shows how pulling messy data together, cleaning it, and running the right analysis can turn a confusing market into something predictable.
Even though this study is about medals, the same approach works anywhere—sneakers, watches, art, even NFTs. The takeaway is simple: once you organize the data, the drivers of value stand out.